Detrended
Correspondence Analysis
Recall that Correspondence Analysis suffers from two major problems: The arch effect (caused by the unimodal species response curves) and compression of the ends of the gradient. Because of the first problem, the second CA axis is an artifact and cannot easily be interpreted. Because of the second problem, the spacing of samples (and species) along the first axis is not necessarily related to the amount of change (or beta diversity) along the primary gradient. Fortunately, since the arch effect is not convoluted like the horseshoe effect of PCA, the samples are ordered in their correct relative locations.
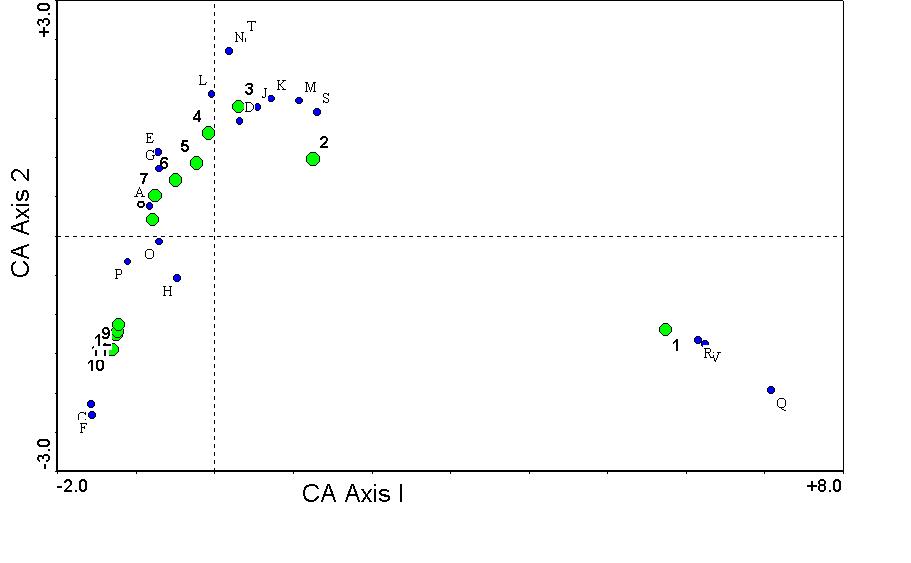
The above graph shoes species scores (blue dots) and sample scores (green dots) for the data set described in Correspondence Analysis , Principal Components Analysis, and elsewhere. The arch effect is pronounced, and it is difficult to tell whether there is indeed a compression on the left hand end of the gradient (or whether this clumping represents reality).
Hill and Gauch (1980) developed a new ordination method, Detrended Correspondence Analysis (DCA), to correct for the major problems of Correspondence Analysis. These problems are corrected in two phases: by Detrending and by Rescaling.
Detrending is the process of removing the arch effect. DCA does this by dividing the first axis into segments, and then by centering the second axis on zero (This process is much better described in Gauch 1982, Pielou 1984, Digby and Kempton 1987, and Kent and Coker 1992). For our Boomer Lake Example, the detrending algorithm goes something like this:
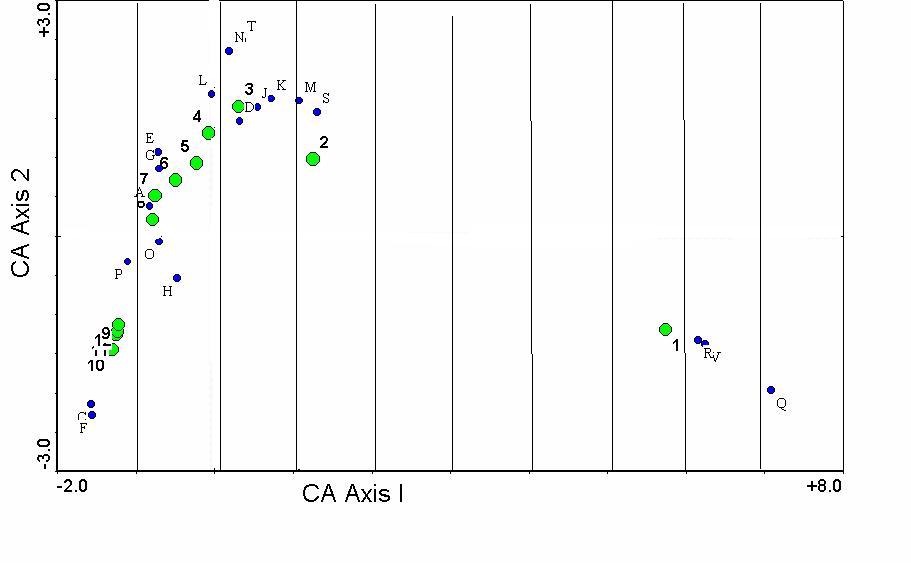
Above, the first CA axis is divided into segments.
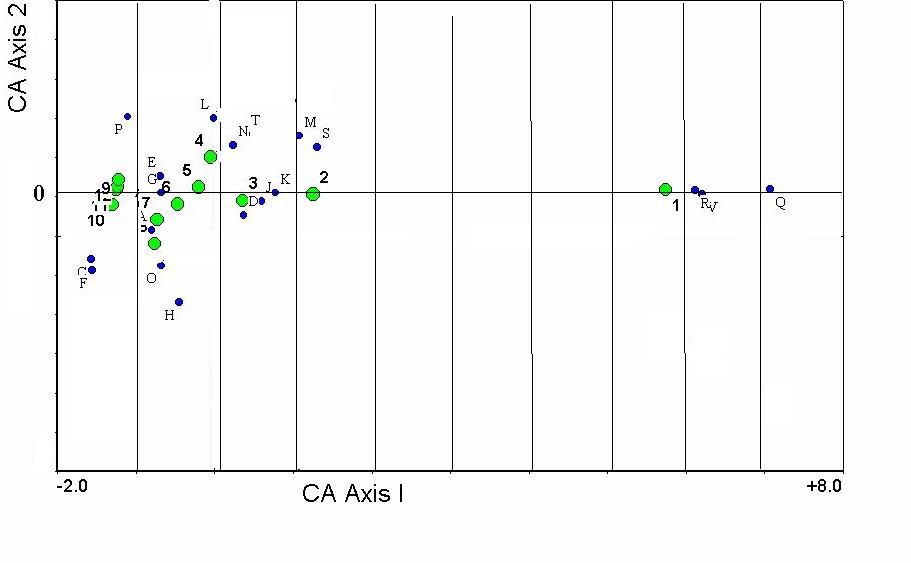
Above, each segment is centered around zero. The above
process is one of the major criticisms of DCA (see Wartenberg et al. 1987
for this and other criticisms): it is rather inelegant, and a lot depends on
the number of segments used. The process has been likened to using a
sledgehammer on your data. However, in an expert hand, even a sledgehammer can
be used quite effectively. DCA repeats the above process several times, each
time shifting the border between segments, so the result will not be too
dependent on the location of the line between segments.
Although detrending is only described for the second axis above, a similar process occurs for third and higher axes.
Rescaling is the process of shifting the positions of samples along ordination axes to make the beta diversity constant. Rescaling is necessary so that a given distance in ordination space means the same thing in different parts of the ordination diagram, or in different ordination diagrams. See Explorations in Coenospace for more information. In DCA, the units are expressed in Standard deviations of species turnover. In other words, the average width (measured in "tolerances" or "standard deviations") of the species response curve is set equal to 1.
A byproduct of this rescaling is the total beta diversity, or gradient length. If the gradient length along the fourth axis is equal to 4, the minimum sample score is zero and the maximum sample score is 4. A gradient this long usually has very few species shared by both ends of the gradient.
In general, higher eigenvalues are related to higher beta diversities, but there are numerous exceptions to this pattern.
The first two DCA axes of the Boomer Lake study show:
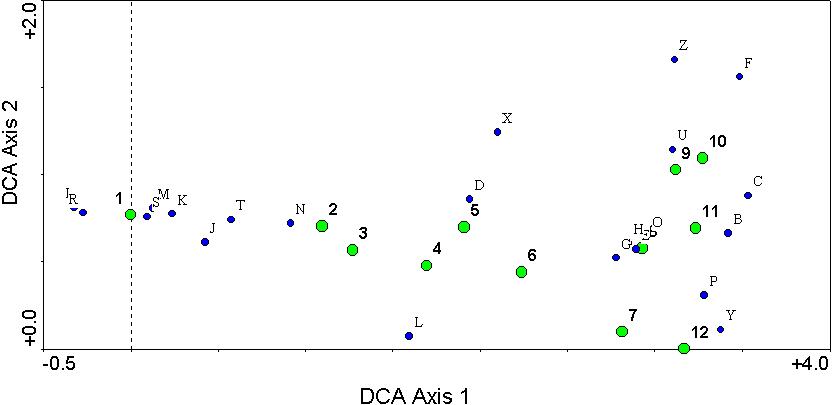
Note several things:
- The arch effect has disappeared.
- There is no longer a compression of the ends of the
gradient.
- The sequence of samples is the reverse from that in CA,
this is something that occasionally occurs but does not affect the
interpretation.
- The minimum sample score is 0 along both axes.
- The maximum sample score is 3.8 along the first axis,
meaning that the gradient length is 3.8 SD units. Almost no species are
shared at the opposite ends of the gradient (i.e. there is a high beta
diversity).
- The first axis species scores correspond quite well
with what we know about the biology of the species: wetland species on the
left, and dryland species on the right.
- The maximum second axis sample score is 1.0 SD units.
The opposite ends of the second axis are therefore rather similar.
- In addition to low beta diversity, there is no clear
biological distinction between species with high second axis scores (e.g.
F,X,Z)and low second axis scores (e.g. L,P,Y). If
we cannot interpret the second axis, it is probably not worthwhile to
interpret the third and higher axes.
- With the rescaling, we can now interpret distances
separating samples more easily. For example, it is clear that sample 1 is
quite different from the remaining samples. Sample 1 is only separated
from sample 2 by 50 cm in the field, yet sample 1 is as different from
sample 2, as sample 2 is from sample 6 (which is 2 meters away in the field).
Another way of saying this is that the way the plants perceive the
lakeshore gradient is different from how we have measured the lakeshore
gradient.
This page was created and is maintained by Michael Palmer.
 To the
ordination web page
To the
ordination web page